
At the end of June, I’m going to begin a new job as a software engineer in Google’s Cambridge office. For the past few months, preparing for this change has kept me too busy to write anything, but now that I have some time, I want to mark the occasion with a post describing the algorithm that got Google started in the first place: PageRank. This will also be a good way to lead into a subsequent post on the Map/Reduce framework for large-scale data analysis algorithms, continuing with the topic of distributed machine learning that I started right before my hiatus. (And, while I’m not a Google employee yet, it probably doesn’t hurt to include the standard disclaimer that the opinions expressed below are my own and have not been endorsed or approved by Google.)
When you type a query into a search engine, the results that it returns generally come from a list that was created in advance from programs called “spiders” that download all the webpages they can find and record information about them. The process of finding all the sites that would match your search is fairly straightforward (at least at small scales – there are lots of technical issues that come up when you try to deal with with billions of pages.)
The tricky part turns out to be that there are usually so many links that would fit the search, that the search engine has to decide which ones to leave out. Or put another way, the problem is to decide (in an automated way) which links should go on the first page of search results and which should go later in the list. (Note that nowadays PageRank is only a small part of a much larger system that Google uses to sort its search results. Moreover, there are a huge number of “SEO experts” employed by other companies whose main job is to figure out this system and redesign web pages so they’ll appear higher on the list.)
Sorting search results was one of the major problems that plagued search engines in the early years of the web and this is where the PageRank algorithm came in. Because the computer can’t interpret the contents of each page the way a person can, PageRank relies on other indicators, namely how many other web pages have links to the web page in question. The assumption is that a web page that many other pages link to is probably important, and should be placed higher on the list. We can think of this in terms of giving each page a score, then sorting the pages so that the pages with the highest scores come first.
The simplest way to do this would be to simply count the number of incoming links to each page and let this number be its score – The page that fits the search terms and has the most incoming links goes first and so on. This would certainly give higher scores to pages with more incoming links, but it would also make it very easy for page designers to game the system. For example, someone might set up 1000 different nearly-identical web sites, all of which link to each other and have pages filled with advertisements, with a list of buzz words at the bottom. Since each of these pages would have 1000 incoming links, they would get a very high score, even though they don’t deserve it.
PageRank attempts to skirt this issue by taking into account not only how many links point to a given page, but how high the scores of the pages that link to it are. This seems like circular logic, though, since you need to know the scores of all the pages before you can calculate their scores. But it turns out you can deal with this issue using something like a feedback loop. If you don’t know what a feedback loop is, don’t worry. The idea is pretty simple.
Imagine that each web page is bucket of water with a pump underneath. Each link from webpage A to webpage B is a tube coming out of the pump underneath bucket A and pouring into bucket B. Three of these buckets are shown in the Figure below. If we fill all the buckets partway up with water, then turn on the pumps, the buckets with more tubes (i.e. links) leading into them will start to fill up, while the buckets with fewer links will start to run out of water. Note that water never enters or leaves the system. In fact, water that leaves a particular bucket will often come back to it at a later time. Or I should say that it will feed back into it. (Get it? Feed back.)

To make this work right, we’ll install special water pumps that speed up when the water level in the bucket rises and that slow down when the water level drops. If we do this correctly, then each bucket will, at some point, reach an equilibrium state where the amount of water removed by the pump is exactly equal to the amount of water coming in from the tubes. (The amount of water coming in from each tube will also reach an equilibrium as the water levels of the other buckets reach equilibrium.)
In other words, at some point the water levels in the different buckets will stop changing. At this point, the more water flowing into any given bucket, the higher its level will be (since a higher water level means the pump is pushing more water out, which is equal to the amount coming in.) So, when the system reaches this point, the web sites/buckets with lots of tubes coming into them will generally have high water levels, while the websites with fewer tubes coming in will have very low levels. We can then read off the each web site’s score from the water level in its bucket.
Note that the group of 1000 sites that all reference each other in the hopes of improving their ranking won’t fare too well under this system: Since they’re all sharing the same amount of water, their water levels will all stay the same. On the other hand, for a web site that doesn’t have a whole lot of links coming in, but these links mostly come from other websites that, in turn, have a lot of incoming links, this system will work relatively well, since the small number of tubes feeding into the bucket will still bring in a lot of water.
Now, as you might expect, the PageRank algorithm is not actually implemented using physical buckets and pumps. But we can think of the algorithm as simulating what would happen in such a system. This is related to a number of ideas in mathematics, such as differential equations and dynamical systems.
There are plenty of very nicely written accounts of how this is technically carried out, but as usual I want to look at it from a more geometric perspective. If you’ve been following this blog, you may be able to predict how we’re going to turn this into a geometry problem (and no, it has nothing to do with shape of the buckets, or the curvature of the tubes.)
Recall that the goal of the PageRank algorithm is to keep track of the water level in each bucket. So this gives us a list of numbers. Well, guess what that list of numbers is… It’s a vector(!) which we can think of as defining a point in some (high-dimensional) space.
In order to visualize the situation, lets consider what would happen if we just had three websites/buckets, so their three scores would give us a point in three-dimensional space. As we noted above, the amount of water in the system is always the same, so while the water levels in the three buckets will change, adding up all the water levels will always give us the same amount. In other words, at any point in time, if we add together the three coordinates of our vector, we’ll get the same number. In most discussions of PageRank, this sum is set to 1.
So, lets start by looking at all the hypothetically possible sets of water levels/scores/vectors. In other words, we want to consider the set consisting of each vector with positive (or, rather, non-negative) coordinates that add up to 1. As it turns out, this set forms a triangle with corners at the vectors (1,0,0), (0,1,0), (0,0,1), like the one shown in the Figure below. This shape is sometimes called the convex hull of these three points – the smallest convex set that contains them. If we did this with four websites, the shape would be a three-dimensional tetrahedron (the convex hull of four points) in four-dimensional space. For more websites, we would get higher-dimensional convex hulls in higher dimensional spaces.
 Getting back to the three-bucket case, if we put water in, the water levels of the three buckets will define some point in this triangle. Imagine that we’ve put the tip of a pen at that point. If we turn on the pumps, the water levels will go up and down and the point will start to move, as its coordinates change. Because the total amount of water doesn’t change, the point will stay in the triangle. Moreover, if we move the tip of the pen along with the point, the pen will trace out some curve on the triangle.
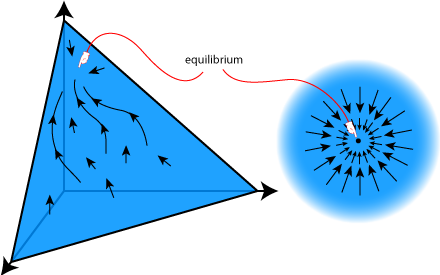
There are two things to note about this thought experiment: First, while we originally said we would start with all the buckets having equal amounts of water (which defines the point at the very center of the triangle), that’s not completely necessary. We could start with any water levels, corresponding to any point in the triangle, then turn on the pumps, and the pen would trace out some curve. Three such (hypothetical) curves are shown in the Figure.
Second, (and this is a lot more subtle) if we stopped the pumps, moved the pen to a different location, then started them again, the second curve traced out by the pen would never cross the curve that was drawn the first time. The reason is that the direction that the pen moves only depends on the current water levels, not where it was a earlier. So if the pen ever gets to a point where it was previously, it will move in the same direction it moved the last time it was there. So if I had drawn more curves, they would look like neatly combed hair – they might be wavy, but they run parallel to each other.
In particular, at each point in the triangle, we can draw a small arrow that shows what direction the curve would go if we started the pen at that point. You can think of this arrow as representing a vector, in which case we call the set of all vectors that arise this way a vector field. (In fact, these arrows are tangent vectors of the curves, which have to do with derivatives, which is why you can think about this in terms of differential equations, but lets not worry about that now.)
If we were to start with all these arrows drawn on the triangle, we could figure out the curve that our system of buckets and pumps would draw by just following the arrows. As it turns out, if we do this right, there will be some point on the triangle (or on the higher dimensional shape if we do this with more buckets) where all the arrows nearby point in towards that point. This is shown on the right of the figure. Any curve that the pen draws would head towards this point. In fact, as the pen gets closer to this point, it will get slower and slower and never quite reach that point. (If Zeno were alive today he would love this.) This point where the paths all come together is the equilibrium where the water levels stop changing, and coordinates of this point define the scores that we want to assign to each of the webpages.
Exactly calculating one of these curves in order to find the equilibrium point, it turns out, is an unnecessarily complex problem. Instead, PageRank calculates an approximation of a curve broken up into a number of steps. It starts at the center of the shape defined by all possible water levels (the center of the triangle in our three-dimensional example) and calculates the direction of the arrow at that point. Then, instead of moving continuously in that direction, it jumps along a straight line along the arrow. Since the actual path might curve a little, this straight line will take the new point off the curve, but it will still be pretty close. Then the algorithm calculates the arrow at this new point, takes another jump and then repeats.
The path traced out by this sequence of jumps won’t follow any of the actual curves exactly, but that’s OK because of the way the arrows all (eventually) point towards the equilibrium point. So the sequence of points calculated by PageRank will also move in this direction. When it gets really close, it will start spiraling around the equilibrium point, taking smaller and smaller steps each time. When the steps get small enough, it means the point is near the equilibrium point and the algorithm stops, taking these final coordinates as a good approximation of the actual equilibrium.
Incidentally, this is very similar in philosophy to many of the gradient methods that I’ve discussed previously on this blog, including logistic regression and mixture models. All of these work by successively updating a set of numbers, and can be formulated in terms of following a path by jumping along a vector field (though I didn’t explain it that way in the earlier posts.)
The equations that determine how the point jumps towards the equilibrium point are pretty simple, and as I mentioned above, there are plenty of places you can read about the details. Where it gets complicated is the fact this has to be done with billions of websites and billions of links. This is far too much for a single computer to handle, so from the very first days of the PageRank algorithm, it has been carried out on distributed networks of computers. This required developing systems to deal with the fact a website stored on one machine in the network will usually link to other websites stored on lots of other machines across the network. In my next post, I’ll discuss one of the systems that was developed to handle this sort of problem, namely Map/Reduce.

Good luck at Google, Jesse! I’m sure you will love it!
Congrats, I was totally aware of this move. Cambridge MA or UK?
Cambridge, MA. I probably should have said Boston…
aware = unaware. Sigh.
A very intuitive explanation thank you.
I am wondering what the significance of the stable point is however? Why are the bucket levels at that point a good measure of importance?
I tried to outline this in the second paragraph after the buckets picture, but it was a bit terse. Here’s a second try: What we really want to measure is how much water is coming in to each bucket, since that correlates to how many links point to the site (and how important the links pointing to the site are.) At equilibrium, the amount of water coming in is equal to the amount going out, since the water level isn’t changing, so we could equivalently measure the amount of water going out.
But instead of measuring either of these, recall that we designed the pumps so that they speed up when the water level rises and slow down when it lowers. In fact, the speed of the pump is proportional to the water level, so we can calculate the amount of water being pumped out by multiplying the water level by a constant. But since we would be multiplying all the water levels by the same constant, we can just drop all the constants and compare the water levels directly.
Does that make sense?
Thank you that does make sense. My other question is how do we know there will be a unique stable point?
I see that we will have a linear system of differential equations Av = v’, subject to v in the n simplex, and that A will have one less than full rank so there is a nontrivial nullspace of dimension 1, but is there a good way to see that this nullspace intersects the simplex? And that it is stable?
Sorry I don’t know much about diff eqs.
Cheers
Good question. When you have the vector jump along the tangent vector, you can write the new vector as the product of the original vector by a square matrix whose entries encode how much water is redistributed from each bucket to every other bucket. The equilibrium point is a vector that is taken to itself when you do this multiplication. In particular, it’s a vector that is sent to a multiple of itself, i.e. an eigenvector.
The matrix that does this turns out to have all non-negative values (this shouldn’t be too hard to see) so the Perron-Frobenius Theorem (http://en.wikipedia.org/wiki/Perron%E2%80%93Frobenius_theorem) implies that it has a unique eigenvector with maximal eigenvalue and non-negative components. This is our equilibrium point. So, you can think of PageRank as a method of approximating the first eigenvector of a matrix that is too large to apply row reduction to.
Great explanation, I did not know that theorem, I can see how it will be very useful in these dynamical/probabilistic systems.
And of course the eigenvalue for a nonnegative eigenvector can only be 1 since water is never created.
I look forward to your next post.
Pingback: Map/Reduce | The Shape of Data
Hi Jesse,
Not sure if you’re still replying to comments on this three-year-old post, but in any case thanks for the great explanation. Before I start on the follow-on piece on Map/Reduce, I was wondering about one detail in the above; I’m hoping you can set me straight.
You write, “if we stopped the pumps, moved the pen to a different location, then started them again, the second curve traced out by the pen would never cross the curve that was drawn the first time.” I’m slightly confused by this: if we move the pen to a different location that happens to be an earlier point on the same continuous path in the vector field on which we were sitting when the pumps are stopped, wouldn’t that cause its location to eventually pass through the original starting location?
Perhaps equivalently (though I’m not sure about that), is it not possible to have two different starting points in a vector field that converge to the same final (equilibrium) point? And if so, is this saying that such convergence can _only_ happen at the equilibrium point, and not before? Or is all of this true in the “in the limit” sense?
Sorry if the above isn’t quite as precise as it should be (I’m not a mathematician). And thanks again for the great write-up.
-Jon
Hi, Jon. Two good questions, and both explanations are correct.
1) If you moved the pen to a spot that’s earlier on the original path, it would end up returning to the place where the original path started, then re-trace that path. But it wouldn’t cross the path, i.e. there wouldn’t be a visible intersection – it would just look like a longer curve.
2) The pen never reaches an equilibrium point because the vectors get shorter and shorter, so the curve only meets the equilibrium point in the limit. So two different curves can only meet at an equilibrium point and in the limit. (Though again they don’t cross – they just meet at their ends. I realize this is a technicality, but I’m sticking to it.)
Hi Jesse,
Makes sense. Thanks for following up!
-J